[et_pb_section bb_built=”1″ admin_label=”section” fullwidth=”on” specialty=”off” inner_shadow=”off” parallax=”off” transparent_background=”off” background_color=”#ffffff” allow_player_pause=”off” parallax_method=”off” padding_mobile=”off” make_fullwidth=”off” use_custom_width=”off” width_unit=”on” make_equal=”off” use_custom_gutter=”off” module_class=”anthemSlider” custom_padding_tablet=”50px|0|50px|0″ custom_padding_last_edited=”on|desktop” next_background_color=”#191919″][et_pb_fullwidth_header title=”Reports” background_layout=”dark” text_orientation=”left” header_fullscreen=”off” header_scroll_down=”off” background_overlay_color=”rgba(104,110,114,0.25)” parallax=”off” parallax_method=”on” content_orientation=”center” image_orientation=”center” custom_button_one=”off” button_one_use_icon=”default” button_one_icon_placement=”right” button_one_on_hover=”on” button_one_letter_spacing_hover=”0″ custom_button_two=”off” button_two_use_icon=”default” button_two_icon_placement=”right” button_two_on_hover=”on” button_two_letter_spacing_hover=”0″ title_font_size=”60px” custom_css_main_element=”padding: 175px 0 140px;” subhead_font_size=”23px” module_class=”et-waypoint fadein-animated” background_url=”https://eliteform.com/wp-content/uploads/2016/12/0004_reportsFeature.jpg” title_font_size_tablet=”48px” title_font_size_phone=”36px” title_font_size_last_edited=”on|phone” subhead=”ELITEFORM STRENGTHPLANNER” background_image=”https://eliteform.com/wp-content/uploads/2016/12/0004_reportsFeature.jpg” content_max_width=”100%” background_color=”rgba(255, 255, 255, 0)” button_one_text_size__hover_enabled=”off” button_one_text_size__hover=”null” button_two_text_size__hover_enabled=”off” button_two_text_size__hover=”null” button_one_text_color__hover_enabled=”off” button_one_text_color__hover=”null” button_two_text_color__hover_enabled=”off” button_two_text_color__hover=”null” button_one_border_width__hover_enabled=”off” button_one_border_width__hover=”null” button_two_border_width__hover_enabled=”off” button_two_border_width__hover=”null” button_one_border_color__hover_enabled=”off” button_one_border_color__hover=”null” button_two_border_color__hover_enabled=”off” button_two_border_color__hover=”null” button_one_border_radius__hover_enabled=”off” button_one_border_radius__hover=”null” button_two_border_radius__hover_enabled=”off” button_two_border_radius__hover=”null” button_one_letter_spacing__hover_enabled=”on” button_one_letter_spacing__hover=”0″ button_two_letter_spacing__hover_enabled=”on” button_two_letter_spacing__hover=”0″ button_one_bg_color__hover_enabled=”off” button_one_bg_color__hover=”null” button_two_bg_color__hover_enabled=”off” button_two_bg_color__hover=”null” /][/et_pb_section][et_pb_section bb_built=”1″ fullwidth=”off” specialty=”off” transparent_background=”off” background_color=”#191919″ allow_player_pause=”off” inner_shadow=”off” parallax=”off” parallax_method=”off” padding_mobile=”off” make_fullwidth=”off” use_custom_width=”off” width_unit=”on” make_equal=”off” use_custom_gutter=”off” custom_padding_tablet=”50px|0|50px|0″ custom_padding_last_edited=”on|desktop” prev_background_color=”#ffffff” next_background_color=”#ffffff”][et_pb_row background_position=”top_left” background_repeat=”repeat” background_size=”initial”][et_pb_column type=”4_4″][et_pb_divider color=”#ffffff” show_divider=”off” divider_style=”solid” divider_position=”top” hide_on_mobile=”on” disabled_on=”on|on|off” /][/et_pb_column][/et_pb_row][/et_pb_section][et_pb_section bb_built=”1″ fullwidth=”off” specialty=”off” prev_background_color=”#191919″ next_background_color=”#1e83ec”][et_pb_row background_position=”top_left” background_repeat=”repeat” background_size=”initial”][et_pb_column type=”4_4″][et_pb_text use_border_color=”off” background_position=”top_left” background_repeat=”repeat” background_size=”initial” _builder_version=”3.16″]
The Reports page enables you to generate reports for Workout Sessions completed by Athletes.
Click Reports in the Navigator to access the Reports page.
[/et_pb_text][/et_pb_column][/et_pb_row][et_pb_row background_position=”top_left” background_repeat=”repeat” background_size=”initial”][et_pb_column type=”1_2″][et_pb_toggle admin_label=”Athlete Session Summary” title=”Athlete Session Summary” title_font=”|on|||” title_font_size=”24″ use_border_color=”off” closed_toggle_background_color=”#ffffff” custom_css_toggle_icon=”font-size: 24px;” title_font_size_tablet=”20″ title_font_size_phone=”16″ title_font_size_last_edited=”on|phone” saved_tabs=”all” background_position=”top_left” background_repeat=”repeat” background_size=”initial” _builder_version=”3.16″]
1. Using the Navigator, expand Reports and select Athlete Session Summary.
2. The Report page is displayed. Specify the following and click the VIEW REPORT button:
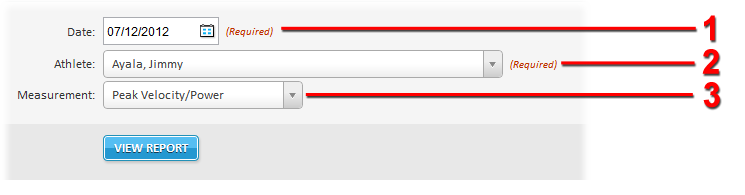
- Date – The date the session was performed.
- Athlete – Select the Athlete for which the report should be generated.
- Measurement – Select whether the report should include Peak Velocity/Power or Average Velocity/Power.
3. The generated report is displayed.
To save the report, click and select one of the following formats:
- XML file with report data
- CSV (comma delimited)
- MHTML (web archive)
- Excel
- TIFF file
- Word
[/et_pb_toggle][et_pb_toggle admin_label=”Daily Exercise” title=”Daily Exercise” title_font=”|on|||” title_font_size=”24″ use_border_color=”off” closed_toggle_background_color=”#ffffff” custom_css_toggle_icon=”font-size: 24px;” title_font_size_tablet=”20″ title_font_size_phone=”16″ title_font_size_last_edited=”on|phone” saved_tabs=”all” background_position=”top_left” background_repeat=”repeat” background_size=”initial” _builder_version=”3.16″]
- Using the Navigator, expand Reports and select Daily Exercise.
- The Report page is displayed. Specify the following and click the VIEW REPORT button:
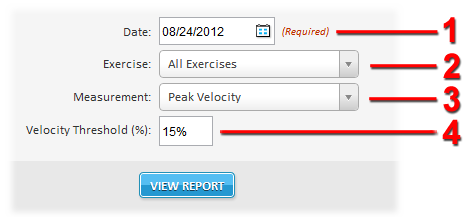
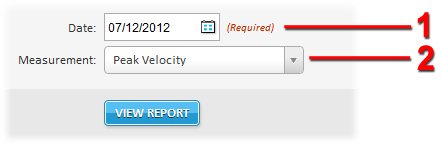
1 – Date – The date the Exercise was performed.
2 – Exercise – Select the Exercise for which the report will be generated. To generate a report for all Exercises performed on the specified date, select “All Exercises”.
3 – Measurement – Select whether the report should include Peak Velocity or Average Velocity.
4 – Velocity Threshold (%)- Determines how the Target Velocity range is represented for each athlete on the report. By default, the Velocity Threshold is set to 15%.
- The generated report is displayed.
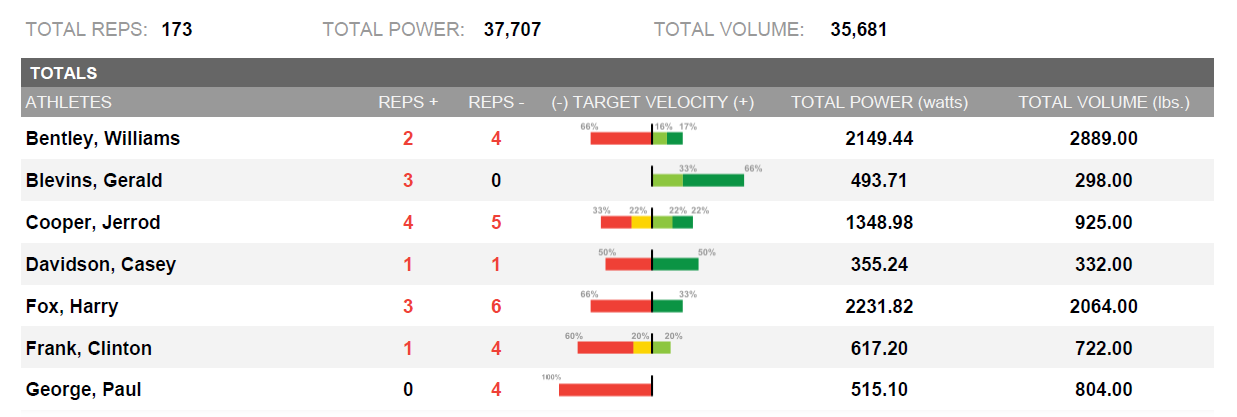
TARGET VELOCITY graphically represents the velocities achieved by athletes relative to those prescribed by their coaches. The percent indicator for each color shows the percentage of reps that fall within each of the following ranges (using the default Velocity Threshold of 15%):
Reps with velocities up to the 15% above the target velocity are classified as Near Target – Above and are colored light green.
Reps with velocities up to 15% below the target velocity are classified as Near Target – Below and are colored yellow.
Reps with velocities more than 15% below the target velocity are classified as Significantly Below Target and are colored red.
Reps with velocities more than 15% above the target velocity are classified as Significantly Above Target and are colored dark green.
TOTAL POWER and TOTAL VOLUME indicate the watts and total weight lifted by each athlete.
To save the report, click and select one of the following formats:
- XML file with report data
- CSV (comma delimited)
- MHTML (web archive)
- Excel
- TIFF file
- Word
[/et_pb_toggle][et_pb_toggle admin_label=”Velocity/Power/Volume” title=”Velocity/Power/Volume” title_font=”|on|||” title_font_size=”24″ use_border_color=”off” border_color=”#ffffff” border_style=”solid” closed_toggle_background_color=”#ffffff” custom_css_toggle_icon=”font-size: 24px;” title_font_size_tablet=”20″ title_font_size_phone=”16″ title_font_size_last_edited=”on|phone” saved_tabs=”all” background_position=”top_left” background_repeat=”repeat” background_size=”initial” _builder_version=”3.16″]
1. Using the Navigator, expand Reports and select Velocity/Power/Volume.
2. The Report page is displayed. Specify the following and click the VIEW REPORT button:
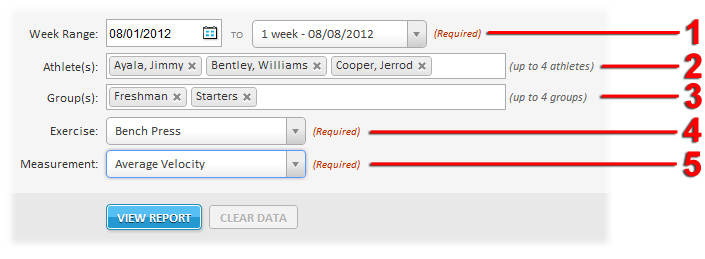
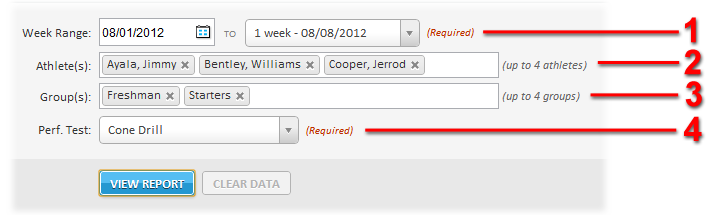
- Week Range – The start and end dates of the report. Reports can only be generated at full-week intervals.
- Athlete(s) – Select from one to four Athletes to be included on the report.
- Group(s) – Optionally select from one to four Positions, Classifications, and Categories to compare against the selected Athlete(s).
- Exercise – Select the Exercise for which the report will be generated.
- Measurement – Select the type of measurement that will be used in the report. Values are:
- Average Velocity
- Peak Velocity
- Average Power
- Peak Power
- Volume (the total amount of weight for the selected time period and exercise)
3. The generated report is displayed.
To save the report, click and select one of the following formats:
- XML file with report data
- CSV (comma delimited)
- MHTML (web archive)
- Excel
- TIFF file
- Word
[/et_pb_toggle][et_pb_toggle admin_label=”1RM Comparison” title=”1RM Comparison” title_font=”|on|||” title_font_size=”24″ use_border_color=”off” border_color=”#ffffff” border_style=”solid” closed_toggle_background_color=”#ffffff” custom_css_toggle_icon=”font-size: 24px;” title_font_size_tablet=”20″ title_font_size_phone=”16″ title_font_size_last_edited=”on|phone” saved_tabs=”all” background_position=”top_left” background_repeat=”repeat” background_size=”initial” _builder_version=”3.16″]
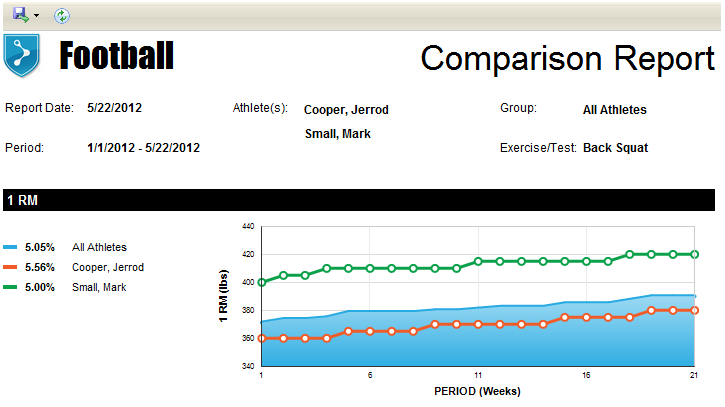
1. Using the Navigator, expand Reports and select 1RM Comparison.
2. The Report page is displayed. Specify the following and click the VIEW REPORT button:
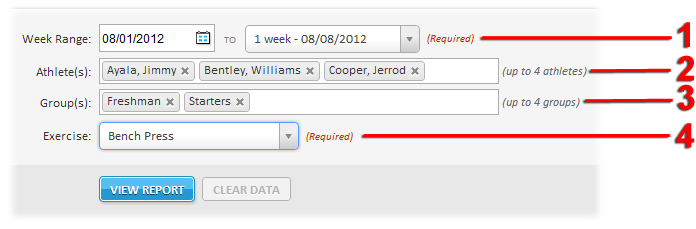
- Week Range – The start and end dates of the report. Reports can only be generated at full-week intervals.
- Athlete(s) – Select from one to four Athletes to be included on the report.
- Group(s) – Optionally select from one to four Positions, Classifications, and Categories to compare against the selected Athlete(s).
- Exercise – Select the Exercise for which the report will be generated.
3. The generated report is displayed.
The shaded area in the chart represents the average of the Group, and each Athlete is represented by a uniquely colored line.
In the list of weeks, any 1RM value change is indicated by listing the new value. If an athlete’s 1RM value hasn’t changed from the previous week, “–” is printed.
If the % of Change value is displayed as “–”, revise the start date of the report to one that contains a 1RM value.
To save the report, click and select one of the following formats:
- XML file with report data
- CSV (comma delimited)
- MHTML (web archive)
- Excel
- TIFF file
- Word
[/et_pb_toggle][/et_pb_column][et_pb_column type=”1_2″][et_pb_toggle admin_label=”Lowest Velocity” title=”Lowest Velocity” title_font=”|on|||” title_font_size=”24″ use_border_color=”off” closed_toggle_background_color=”#ffffff” custom_css_toggle_icon=”font-size: 24px;” title_font_size_tablet=”20″ title_font_size_phone=”16″ title_font_size_last_edited=”on|phone” saved_tabs=”all” background_position=”top_left” background_repeat=”repeat” background_size=”initial” _builder_version=”3.16″]
1. Using the Navigator, expand Reports and select Lowest Velocity.
2. The Report page is displayed. Specify the following and click the VIEW REPORT button:
- Date – The date the session was performed.
- Measurement – Select whether the report should include Peak Velocity or Average Velocity
3. The generated report is displayed.
To save the report, click and select one of the following formats:
- XML file with report data
- CSV (comma delimited)
- MHTML (web archive)
- Excel
- TIFF file
- Word
[/et_pb_toggle][et_pb_toggle admin_label=”Best Velocity” title=”Best Velocity” title_font=”|on|||” title_font_size=”24″ use_border_color=”off” border_color=”#ffffff” border_style=”solid” closed_toggle_background_color=”#ffffff” custom_css_toggle_icon=”font-size: 24px;” title_font_size_tablet=”20″ title_font_size_phone=”16″ title_font_size_last_edited=”on|phone” saved_tabs=”all” background_position=”top_left” background_repeat=”repeat” background_size=”initial” _builder_version=”3.16″]
1. Using the Navigator, expand Reports and select Best Velocity.
2. The Report page is displayed. Specify the following and click the VIEW REPORT button:
- Date – The date the session was performed.
- Measurement – Select whether the report should include Peak Velocity or Average Velocity
3. The generated report is displayed.
To save the report, click and select one of the following formats:
- XML file with report data
- CSV (comma delimited)
- MHTML (web archive)
- Excel
- TIFF file
- Word
[/et_pb_toggle][et_pb_toggle admin_label=”Body Weight” title=”Body Weight” title_font=”|on|||” title_font_size=”24″ use_border_color=”off” border_color=”#ffffff” border_style=”solid” closed_toggle_background_color=”#ffffff” custom_css_toggle_icon=”font-size: 24px;” title_font_size_tablet=”20″ title_font_size_phone=”16″ title_font_size_last_edited=”on|phone” saved_tabs=”all” background_position=”top_left” background_repeat=”repeat” background_size=”initial” _builder_version=”3.16″]
1. Using the Navigator, expand Reports and select Body Weight.
2. The Report page is displayed. Specify the following and click the VIEW REPORT button:

- Week Range – The start and end dates of the report. Reports can only be generated at full-week intervals.
- Athlete(s) – Select from one to four Athletes to be included on the report.
- Group(s) – Optionally select from one to four Positions, Classifications, and Categories to compare against the selected Athlete(s).
3. The generated report is displayed.
To save the report, click and select one of the following formats:
- XML file with report data
- CSV (comma delimited)
- MHTML (web archive)
- Excel
- TIFF file
- Word
[/et_pb_toggle][et_pb_toggle admin_label=”Performance Tests” title=”Performance Tests” title_font=”|on|||” title_font_size=”24″ use_border_color=”off” closed_toggle_background_color=”#ffffff” custom_css_toggle_icon=”font-size: 24px;” title_font_size_tablet=”20″ title_font_size_phone=”16″ title_font_size_last_edited=”on|phone” saved_tabs=”all” background_position=”top_left” background_repeat=”repeat” background_size=”initial” _builder_version=”3.16″]
1. Using the Navigator, expand Reports and select Performance Tests.
2. The Report page is displayed. Specify the following and click the VIEW REPORT button:
- Week Range – The start and end dates of the report. Reports can only be generated at full-week intervals.
- Athlete(s) – Select from one to four Athletes to be included on the report.
- Group(s) – Optionally select from one to four Positions, Classifications, and Categories to compare against the selected Athlete(s).
- Perf. Test – Select the Performance Exercise for which the report will be generated.
3. The generated report is displayed.
To save the report, click and select one of the following formats:
- XML file with report data
- CSV (comma delimited)
- MHTML (web archive)
- Excel
- TIFF file
- Word
[/et_pb_toggle][/et_pb_column][/et_pb_row][/et_pb_section][et_pb_section bb_built=”1″ fullwidth=”off” specialty=”off” transparent_background=”off” background_color=”#1e83ec” allow_player_pause=”off” inner_shadow=”off” parallax=”off” parallax_method=”off” padding_mobile=”on” make_fullwidth=”off” use_custom_width=”off” width_unit=”on” make_equal=”off” use_custom_gutter=”off” custom_padding=”20px||5px|” disabled_on=”off|off|off” disabled=”off” module_class=”anthemSlimOptin” custom_css_main_element=”background-image: -webkit-gradient(linear, left bottom, right top, from(#62d8e4), to(#26baf2));||background-image: -webkit-linear-gradient(left bottom, #62d8e4, #26baf2);||background-image: -moz-linear-gradient(left bottom, #62d8e4, #26baf2);||background-image: -o-linear-gradient(left bottom, #62d8e4, #26baf2);||background-image: -ms-linear-gradient(left bottom, #62d8e4, #26baf2);||background-image: linear-gradient(left bottom, #62d8e4, #26baf2);||filter: progid:DXImageTransform.Microsoft.gradient(GradientType=1,StartColorStr=’#62d8e4′, EndColorStr=’#26baf2′);||” prev_background_color=”#ffffff” custom_padding_tablet=”20px||5px|” global_module=”204171″][et_pb_row global_parent=”204171″ make_fullwidth=”off” use_custom_width=”off” width_unit=”on” use_custom_gutter=”off” custom_padding=”0px||0px|” padding_mobile=”on” allow_player_pause=”off” parallax=”off” parallax_method=”off” make_equal=”off” parallax_1=”off” parallax_method_1=”off” column_padding_mobile=”on” parallax_2=”off” parallax_method_2=”off” background_position=”top_left” background_repeat=”repeat” background_size=”initial”][et_pb_column type=”1_2″][et_pb_text admin_label=”Title” global_parent=”204171″ background_layout=”dark” text_orientation=”left” use_border_color=”off” border_color=”#ffffff” border_style=”solid” text_font=”|||on|” text_font_size=”30″ custom_css_main_element=”font-weight: 900;” custom_margin=”||0px|” custom_padding=”||5px|” module_class=”anthemSlimOptinTitle” custom_padding_tablet=”||0px|” custom_padding_last_edited=”on|phone” custom_padding_phone=”||5px|” background_position=”top_left” background_repeat=”repeat” background_size=”initial”]
Want to know what’s new?
[/et_pb_text][et_pb_text global_parent=”204171″ background_layout=”dark” text_orientation=”left” use_border_color=”off” border_color=”#ffffff” border_style=”solid” custom_margin=”||0px|” custom_padding=”||0px|” custom_padding_tablet=”||10px|” custom_padding_last_edited=”on|tablet” text_line_height=”1.4em” background_position=”top_left” background_repeat=”repeat” background_size=”initial”]
Sign up and we’ll keep you up to date
[/et_pb_text][/et_pb_column][et_pb_column type=”1_2″][et_pb_contact_form admin_label=”Slim Opt-in 2 Fields” global_parent=”204171″ captcha=”off” use_redirect=”off” input_border_radius=”3″ use_border_color=”off” border_color=”#ffffff” border_style=”solid” custom_button=”on” button_use_icon=”off” button_icon_placement=”right” button_on_hover=”on” button_letter_spacing_hover=”4″ title_text_color=”#ffffff” button_text_color=”#ffffff” button_bg_color=”#50d18d” button_bg_color_hover=”#58e896″ button_letter_spacing_hover_last_edited=”on|phone” module_class=”anthemSlimOptinTwoFields” email=”info@eliteform.com” title=”Sign up for the newsletter” success_message=”Thanks for reaching out! We will keep you up to date on the latest info.” custom_message=”I want to sign up for the newsletter||et_pb_line_break_holder||%%Name%% %%Email%%” border_radii=”on|3px|3px|3px|3px”][et_pb_contact_field field_title=”Name” field_type=”input” field_id=”Name” required_mark=”on” fullwidth_field=”off” field_background_color=”#ffffff” input_border_radius=”0″ form_field_font_select=”default” form_field_font=”||||” use_border_color=”off” border_style=”solid”]
[/et_pb_contact_field][et_pb_contact_field field_title=”Email” field_type=”email” field_id=”Email” required_mark=”on” fullwidth_field=”off” field_background_color=”#ffffff” input_border_radius=”0″ form_field_font_select=”default” form_field_font=”||||” use_border_color=”off” border_style=”solid”]
[/et_pb_contact_field][/et_pb_contact_form][/et_pb_column][/et_pb_row][/et_pb_section]